
Updated July 2026. All figures reflect the latest 12 months of Notify Me! platform data: 15.2 million back-in-stock requests across 20,600+ Shopify stores, July 2025 – June 2026.
Effective inventory management is critical for eCommerce businesses. Understanding customer demand, particularly for out-of-stock products, allows merchants to optimize their inventory levels, ensuring they capitalize on every sales opportunity. This report provides an in-depth analysis of back-in-stock requests generated through the Notify Me! app, offering valuable insights to help you make data-driven decisions.
1. Distribution of Requests by Day and Hour
The timing of customer engagement is crucial for inventory management. Analyzing when customers are most likely to request notifications for out-of-stock items helps you strategically anticipate demand and restock products.
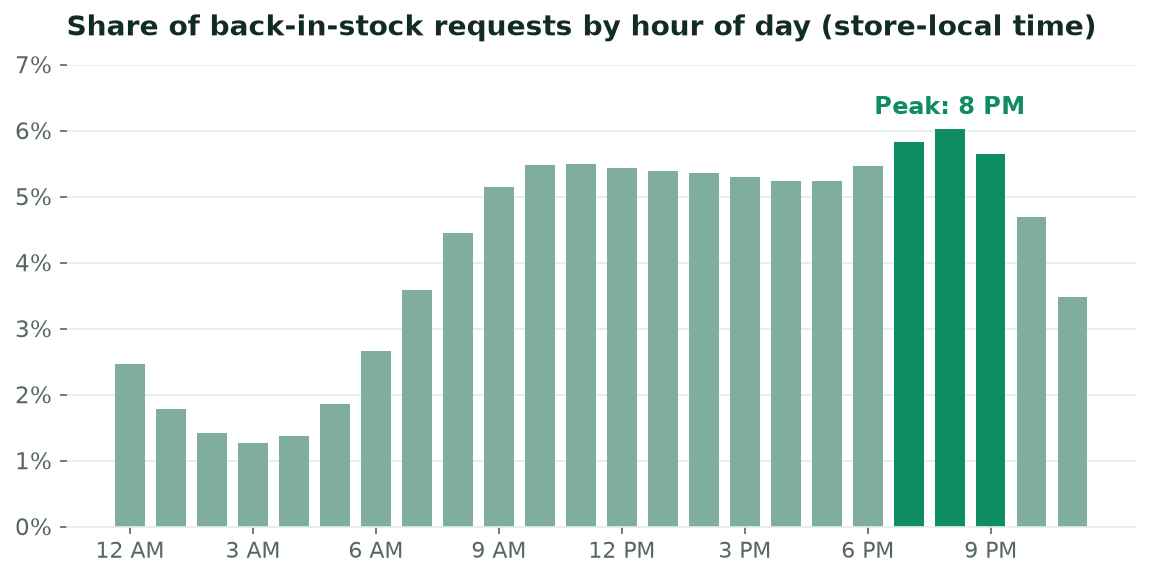
Share of requests by hour of day, store-local market time (approximated by store country). July 2025 – June 2026.
Insights
- Peak hours: Requests build from 6 AM and hit their high between 7 PM and 10 PM local time, with 8 PM the busiest hour of the day. People look for sold-out products in the evening, after work.
- Around the clock: More than 40% of requests come in outside standard business hours (6 AM–6 PM). Demand keeps building while your team is offline.
- Peak days: Demand barely slows down. Sunday is the busiest day and Saturday the quietest, but they’re only about 10% apart.
What this means. Get your restocks live before the evening rush. Products that come back in stock in the morning catch the full shopping day, including the 8–10 PM peak, while anything that waits for the next business day leaves overnight demand unanswered.
2. Distribution of Requests by Month
Understanding seasonal demand patterns is essential for effective inventory planning. This section analyzes the distribution of back-in-stock requests throughout the year, helping you prepare for fluctuations in customer demand.
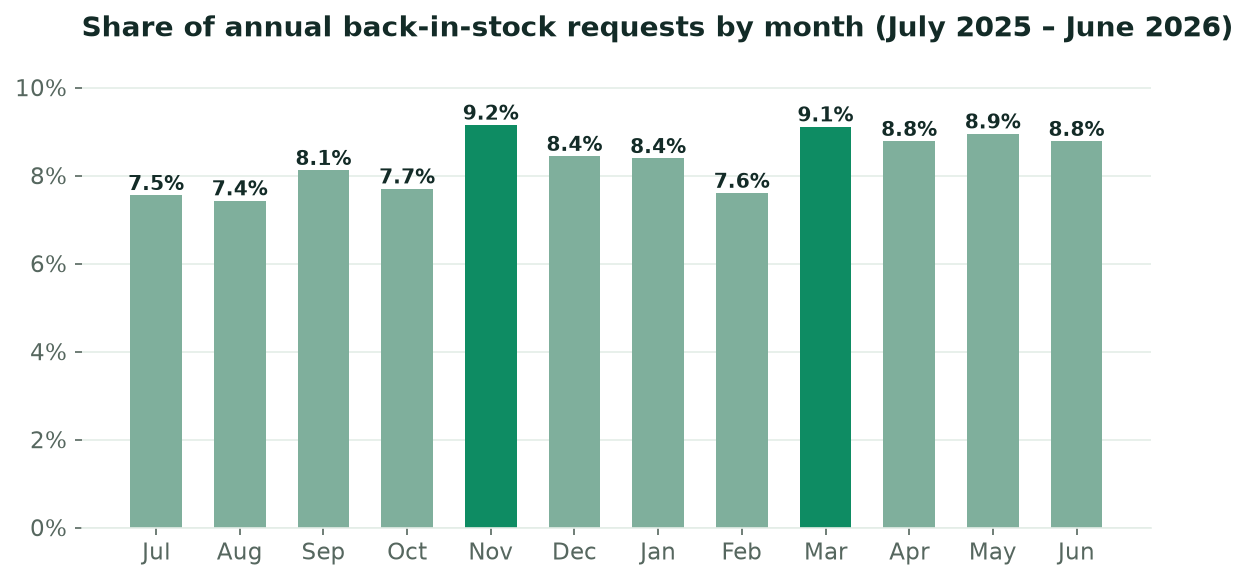
Each month’s share of annual back-in-stock requests, July 2025 – June 2026.
Insights
- Peak months: November leads the year at 9.2% of all requests, driven by holiday-season sellouts, followed closely by March (9.1%) and May (9.0%), a spring surge as new seasonal collections sell through.
- A steady baseline: No month falls below 7.4% of annual volume. Out-of-stock demand runs year-round, with two waves on top: one in Q4, one in spring.
What this means. Start building up stock and preparing your notification flows as early as October to meet holiday demand, and don’t ease off once the holidays pass. The spring wave (March–May) is nearly as big, so plan a second restocking push for late February.
3. Request Growth After Installation
The age of a Notify Me! installation has a direct correlation with the number of back-in-stock requests a merchant receives. This section explores how request volume compounds over time, indicating the long-term value the app brings to merchants.
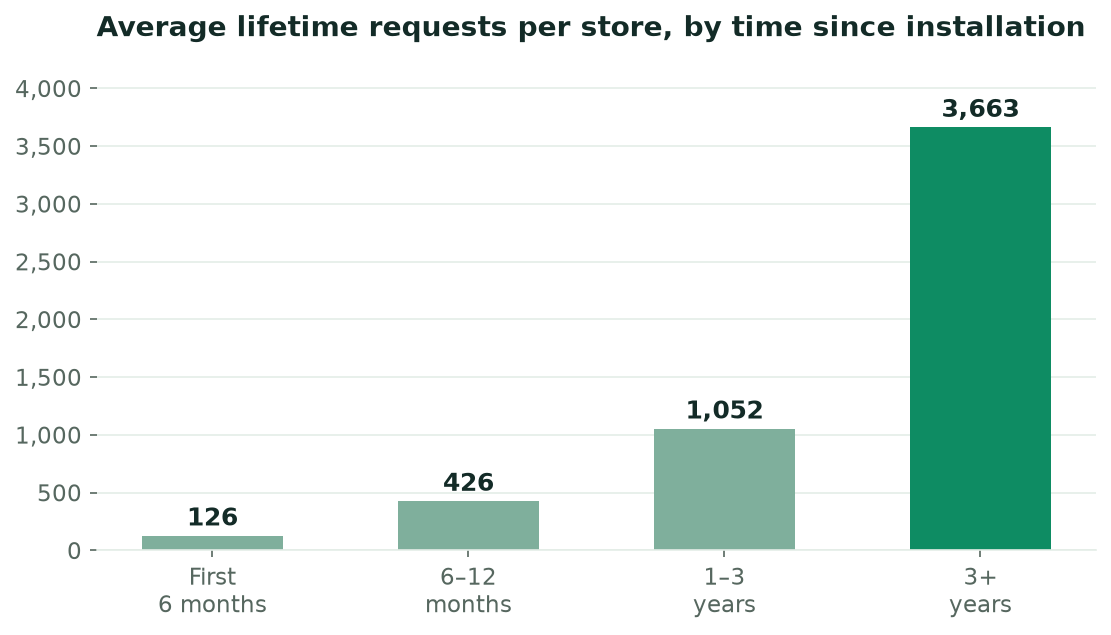
Average lifetime requests per store by installation age, among currently installed stores with at least one request.
Insights
- Steady growth over time: Among stores that capture requests, the average store collects around 125 requests in its first six months. That grows to roughly 425 by the end of year one, about 1,050 for stores one to three years in, and more than 3,650 past the three-year mark.
- A compounding effect: The longer the widget is live, the more shoppers learn to use it, and the more complete your picture of hidden demand becomes.
What this means. The app gets more valuable the longer it runs. Turn on the notify-me widget across your full catalog from day one: every month it’s live on every product is a month of demand data — and recoverable sales — you can’t get back.
4. How Much Demand Does a Typical Store Capture?
Request volume varies enormously from store to store. Benchmarks help you judge whether your waitlist is performing like your peers’.
Insights
- The median store captured 21 back-in-stock requests over the last year.
- The curve is steep: The top quartile of stores captured 149 or more, the top decile passed 1,000, and the top 1% collected over 12,800 requests in a single year.
- What sets them apart is usually catalog size, traffic, and — critically — widget coverage across every sold-out variant and market.
What this means. Count your requests from the past 12 months and find yourself on this curve. If you’re below the median with healthy traffic, check that the widget is enabled across your entire catalog and all sales channels. Most missing volume is a coverage problem, not a demand problem.
The bottom line. This report shows when back-in-stock demand actually happens: evenings over mornings, Sundays as much as weekdays, November and March above all. By lining up your restock timing with these patterns, and measuring your own request volume against the benchmarks, you can anticipate demand, keep inventory at the right levels, and capture sales your competitors write off.
Notify Me! gives merchants a real way to capture sales that would otherwise be lost to stock shortages. The demand is there around the clock. The only question is whether your store is set up to catch it.