
Averages hide the spread — and in back-in-stock performance, the spread is enormous. To give you something concrete to measure against, we computed store-level rates for every store with at least 100 alerted requests over the last year (3,908 stores) and lined them up. Here is the league table.
1. The Conversion League Table
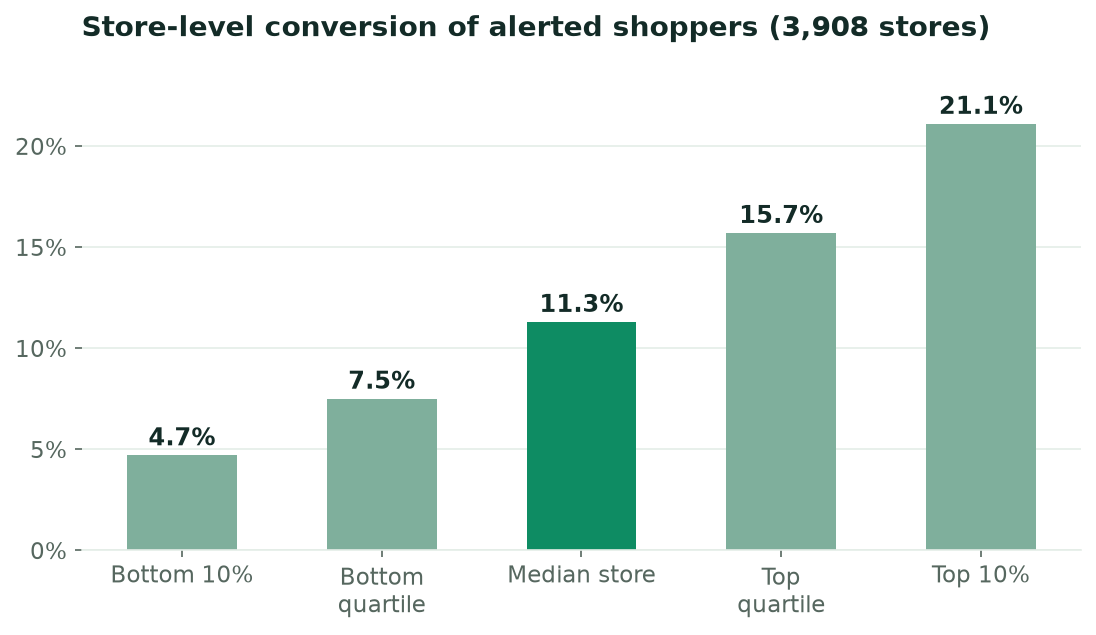
Distribution of alerted-shopper purchase rates across 3,908 stores with ≥100 alerted requests. July 2025 – March 2026 cohorts.
Insights
- The median store converts 11.3% of its alerted shoppers.
- Top performers: The top quartile clears 15.7%, and the top 10% of stores convert more than one in five alerted shoppers (21.1%).
- The bottom quartile sits below 7.5% — usually a sign of slow restocks, email-only alerts, or notification delays rather than weak demand.
What this means. Find your own rate and place yourself on this curve. Above 15.7%, you’re in the top quarter of all stores. Below 7.5%, the data says the gap is rarely about your products, so check restock speed first, then channel coverage.
2. What Back in Stock Is Worth per Store
Insights
- The median store generated $831 in back-in-stock sales over the year, among the 10,500+ stores with attributed sales.
- The curve steepens fast: The top quartile clears $5,300, the top decile $23,300, and the top 1% of stores pull in $239,000 a year from restock alerts alone.
- Restock discipline: The median store restocks 67% of its requested products; the top quartile restocks 82%.
What this means. The distance between the median store and the top decile isn’t luck — it’s catalog coverage, restock rate, and channel choice compounding. Each lever in this series moves you up this curve.
3. Around the World
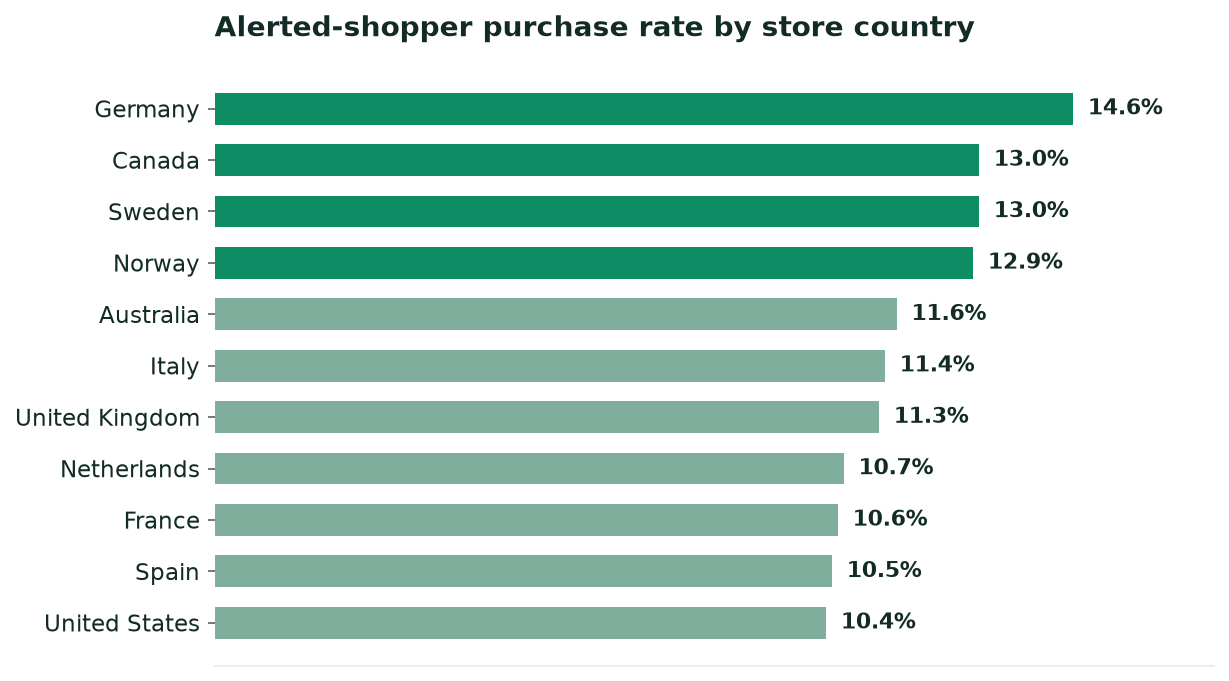
Alerted-shopper purchase rate by store country, markets with the highest request volume. July 2025 – March 2026 cohorts.
Insights
- Germany leads the major markets at 14.6%, with Canada, Sweden, and Norway close behind at around 13%.
- The United States generates 44% of global request volume and converts at 10.4% — right at the global benchmark.
- Every major market clears 10%: back-in-stock conversion travels remarkably well across regions, currencies, and languages.
What this means. If you sell into Germany, the Nordics, or Canada, expect above-average waitlist conversion. And wherever you sell, the benchmark is now public: one in nine alerted shoppers should be buying.
The bottom line. Benchmarks turn a feature into a program. Now that you know what the median store hits, and what the leaders hit, every point of conversion between you and the top decile has a number attached to it.